The Market's Memory
This isn't a history of dates. It's an operating map of who gets destroyed and who reaches the bottom with liquidity —and why the same knot repeats for two centuries, even as the one who ties it changes.
The pattern that repeats
Beneath the noise of every era there's a single mechanism. It ignites always in the same order, and always ends by separating two classes of people: those who survive with cash and access, and those who are forcibly liquidated.
- IBottleneckA resource, a credit line or a trust becomes scarce. The price of what everyone wants goes up.
- IILeveragePeople borrow so as not to be left out. Margin amplifies the rise… and preloads the fall.
- IIIBreakdown of trust in creditSomeone can't pay. Fear spreads: no one lends, credit freezes.
- IVSurvival of those with liquidity and accessWhoever arrives with cash and no debt isn't liquidated. They can wait. They can choose.
- VBuying at the bottomWhoever holds cash buys quality at panic prices and defines the next decade.
The pattern repeats; the outcome changes. What decides the ending isn't the mechanism —it's always the same— but the institutional regime: whether a lender of last resort exists, whether it has the capacity, and whether it has the will to break its own rules to intervene.
Historical arc
Twelve sessions of the same game. In each folder, the essential thing isn't the fall: it's who didn't get destroyed.
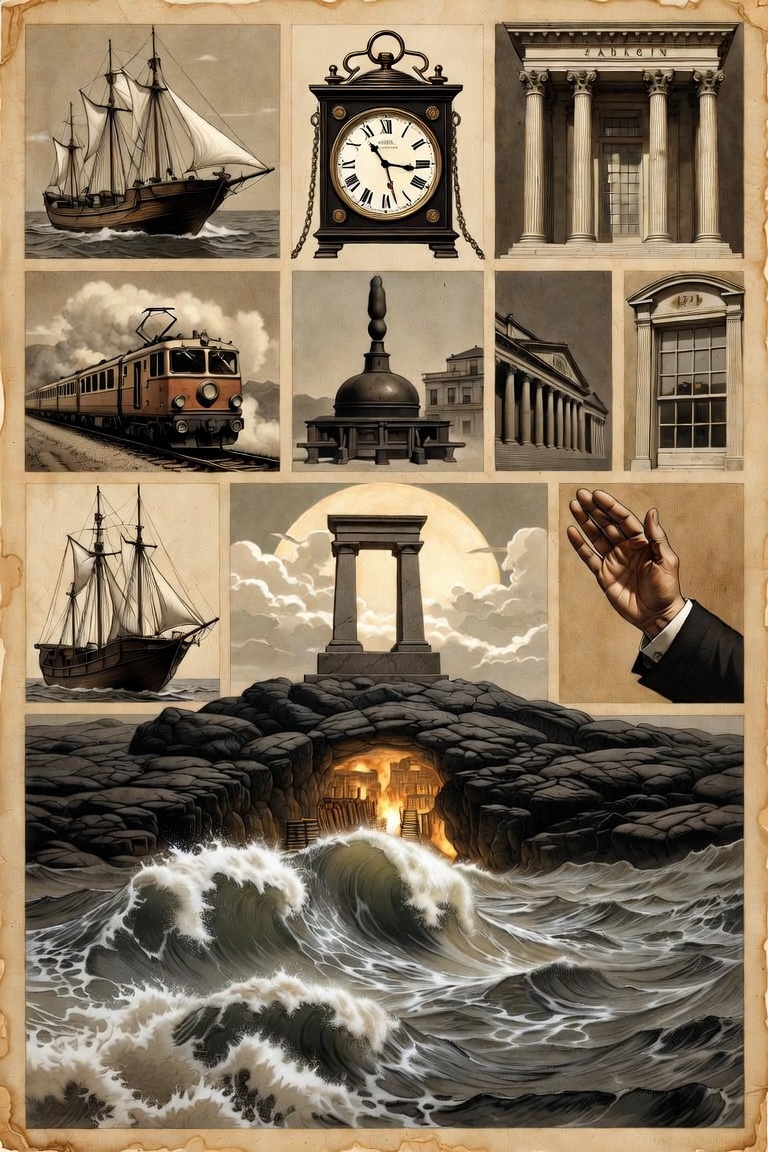
1792–1913Origins, panics and the birth of the Fed›
Under a buttonwood tree on Wall Street, twenty-four brokers sign the Buttonwood Agreement (1792): the future NYSE is born. A century of recurring panics follows —1837, 1857, 1873, 1893, 1907— with no lender of last resort. When trust in credit broke, there was no institution to halt the fall: only the will of a private individual.
In 1907, J. P. Morgan gathers the bankers in his library and organizes the rescue with his own capital and that of his peers. The panic is stopped by a private, not public, decision. From that fragility the Federal Reserve (1913) is born: for the first time, an institutional lender of last resort. (In 1912 the Titanic sinks; we merely note the temporal coincidence, with no theory attached.)
1914–1918The closed NYSE: a parenthesis of power›
When the Great War breaks out, the NYSE closes for nearly four months —the longest shutdown in its history— to halt the massive asset liquidation by Europeans. When it reopens, money and industry have quietly reorganized.
The war sectors —steel, chemicals, munitions, railroads and the banks financing the Allies— surge; the laggards fall behind. The U.S. shifts from debtor to creditor of the world.
1919–1922The Forgotten Depression: the cleansing›
With the war over, a short, sharp depression (1920–1921) arrives: brutal deflation, prices and wages fall hard, the over-leveraged of the war boom go bust. Almost without state intervention.
It was the cleansing that left the ground cheap before the decade's great boom.
1922–1929Roaring Twenties: margin and glamour›
Electricity, radio, the automobile and consumer credit. The market rises almost vertically, fed by buying on margin —up to 90% of the capital borrowed—. The glamour stocks are born: RCA, automakers, utilities. Euphoria is mistaken for permanence.
The leverage that drives the rise is the same that guarantees the violence of the fall.
Oct. 1929Black Thursday · Monday · Tuesday›
Black Thursday (Oct 24), Black Monday (28, −13%) and Black Tuesday (29, −12%). The mechanics of margin in pure form: as the price falls the margin calls arrive; the leveraged investor must sell to cover; that forced selling drops the price further and triggers new margin calls.
A self-reinforcing spiral: it's not caused by pessimism, it's caused by debt.
1929–1933The Great Depression: −89%›
From the 1929 peak to the 1932 bottom, the Dow falls about −89%. Waves of bank panics arrive: thousands of banks fail, credit evaporates and money with it. With no deposit insurance yet, savings vanish.
What got destroyed were the leveraged, the fragile banks and everyone who had to sell at the bottom.
1945–60sPostwar: the shock absorbers›
Bretton Woods (1944) sets the monetary order: the dollar anchored to gold and the other currencies to the dollar. The safety nets of the 1930s —deposit insurance (FDIC), the SEC, banking regulation— reduce structural fragility.
A long, stable industrial and consumer boom follows: for the first time the system has shock absorbers designed so that 1929 doesn't repeat.
1971 + 70sNixon closes the gold window›
On August 15, 1971, Nixon closes the gold window: the dollar stops being convertible. A detail almost no one highlights: the next day the Dow rose —the market celebrated the announcement—. The damage wasn't that session.
The damage was the new regime: fiat money and, in the following decade, stagflation, double-digit inflation, the oil embargo (1973) and gold soaring. The asset that protected wasn't the index: it was gold and energy.
1987Black Monday: −22.6% in a day›
On October 19, 1987 the Dow falls −22.6% in a single session: the largest daily percentage drop in history. The trigger is technical —program trading and the automatic "portfolio insurance" that sold in cascade—.
Difference from 1929: Greenspan's Fed acts immediately, floods liquidity and backstops the system. It doesn't turn into a depression: the market recovers in months.
2000 · 2008Dot-com and the financial crisis›
Dot-com (2000): leverage of expectations about the internet; the Nasdaq falls about −78% from the peak. 2008: leverage of credit —subprime mortgages, securitization, shadow banking—; Lehman fails and trust in credit breaks again. The same knot as 1907 and 1929.
The difference: this time the lender of last resort acts at massive scale —bailouts, TARP, QE, zero rates—. The same logic of leverage and credit; a different outcome because of the intervention.
Survival portfolios
These aren't portfolios to "win the year." They're portfolios to stay standing when everyone else is liquidated —and to reach the bottom with something to buy with.
1929–1933
- Liquidity: cash and Treasury debt. The power to wait.
- Quality: companies with cash and real demand, not promises.
- Zero margin: no debt that forces you to sell.
- Buy at the bottom: deploy in 1932, not before.
2008
- Cash over short-term return.
- No subprime and nothing that depends on easy credit.
- No leverage: survive someone else's margin call.
- Deploy in March 2009, at peak fear.
Current strategic lists
Forty names read with the logic of the file: the ability to survive a credit bottleneck and to recover, and exposure to structural spending (defense, infrastructure, compute). Each symbol links to its analysis on Faro.
| Symbol | Company | Why it's on the list |
|---|---|---|
| BRK.B | Berkshire Hathaway | Cash and discipline; buys when others sell. |
| JPM | JPMorgan Chase | The bank that tends to come out stronger from every crisis. |
| AAPL | Apple | Net cash, brand and massive buybacks. |
| MSFT | Microsoft | Recurring software revenue; top-quality balance sheet. |
| GOOGL | Alphabet | Abundant cash and advertising dominance. |
| AMZN | Amazon | Consumer and cloud infrastructure. |
| WMT | Walmart | Defensive consumer; gains share in recession. |
| COST | Costco | Membership and inelastic demand. |
| PG | Procter & Gamble | Consumer staples; cycle-proof revenue. |
| JNJ | Johnson & Johnson | Healthcare and a long-lived dividend. |
| UNH | UnitedHealth | Scale in health insurance. |
| XOM | Exxon Mobil | Integrated energy; cash in up-cycles. |
| CVX | Chevron | Energy with a solid balance sheet. |
| LMT | Lockheed Martin | Defense; multi-year public backlog. |
| GD | General Dynamics | Defense and naval; revenue with a public signature. |
| RTX | RTX (Raytheon) | Diversified defense and aerospace. |
| PLTR | Palantir | Data software for government and enterprise. |
| AVGO | Broadcom | Semiconductors + software; high cash flow. |
| V | Visa | The toll on payments; structural margin. |
| MA | Mastercard | The other toll on global payments. |
| Symbol | Company | Structural exposure |
|---|---|---|
| LMT | Lockheed Martin | Weapons systems; Pentagon prime. |
| NOC | Northrop Grumman | Bombers, space and nuclear deterrence. |
| GD | General Dynamics | Naval, land and systems. |
| RTX | RTX | Missiles, air defense and engines. |
| LHX | L3Harris | Tactical communications and electronic warfare. |
| ESLT | Elbit Systems | Israeli defense; sustained global demand. |
| PLTR | Palantir | Defense and intelligence software layer. |
| RKLB | Rocket Lab | Launch + defense satellites (see File 01). |
| BA | Boeing | Civil and military aerospace; duopoly. |
| GE | GE Aerospace | Aircraft engines; huge installed base. |
| HON | Honeywell | Aerospace and industrial infrastructure. |
| TDG | TransDigm | Proprietary aircraft parts; pricing power. |
| ATI | ATI Inc. | Alloys and titanium for aerospace-defense. |
| CRS | Carpenter Technology | Critical specialty steels and alloys. |
| MP | MP Materials | Rare earths; strategic supply chain. |
| IONQ | IonQ | Trapped-ion quantum computing. |
| RGTI | Rigetti Computing | Superconducting quantum. |
| QBTS | D-Wave Quantum | Quantum annealing. |
| ASTS | AST SpaceMobile | Direct-to-cell satellite; space-telecom. |
| HII | Huntington Ingalls | Shipbuilder for the U.S. Navy. |
Clarification: these are not personalized recommendations. They are survival-probability maps and maps of exposure to structural spending, to study —not to execute blindly—.
Final analysis
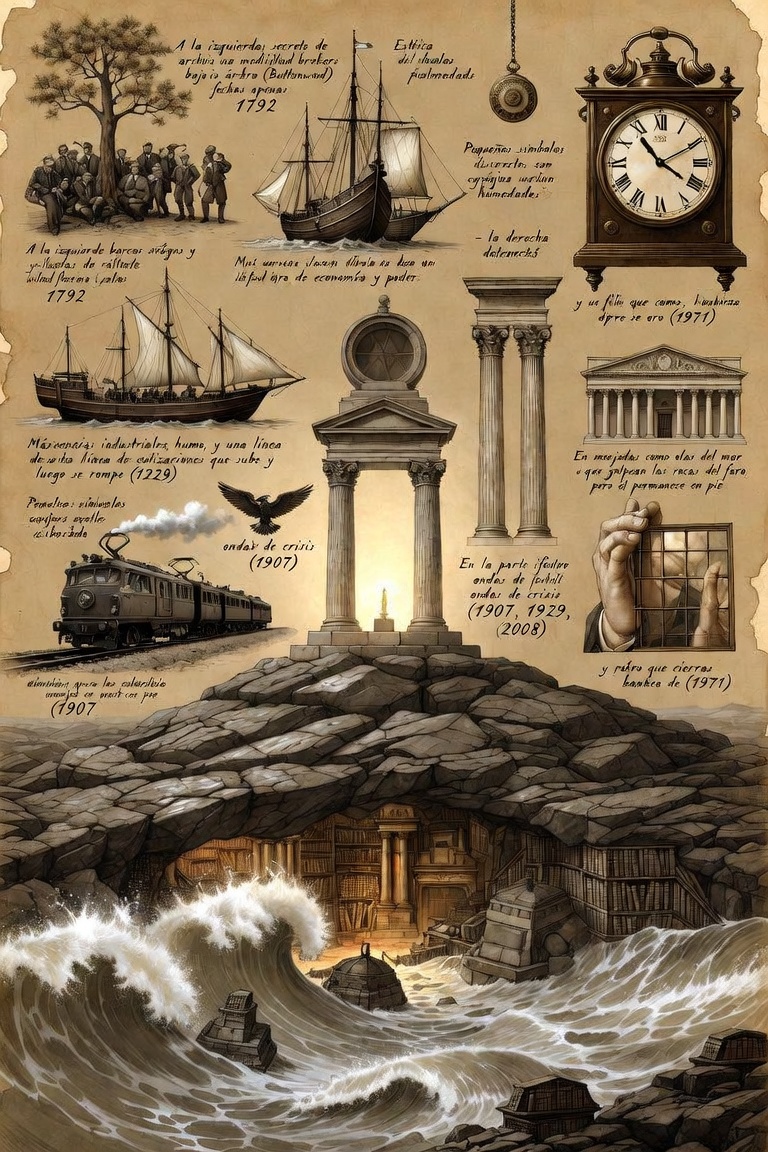
- Leverage repeats; power decides the ending. The knot is always the same. The outcome depends on who controls the liquidity and what they're willing to break in order to use it.
- 1914 — the parenthesis of power. With the NYSE closed, power quietly reorganized. Sometimes the important move happens when the market isn't trading.
- 1971 — the market celebrated the announcement. The Dow rose the day after the gold window closed. The real damage wasn't the session: it was the new regime that began that day.
- 1987 and 2008 — same fall, different ending. Identical verticality; opposite institutional results. The difference was the will and the capacity to intervene.
- Where the pattern can break. When the capacity to intervene fails (debt or sovereignty compromised) or the will does (political constraint), or when leverage lives outside the visible system —shadow, derivatives, crypto— where the lender of last resort doesn't reach.
- The close. The tool isn't guessing the crisis. It's recognizing which phase of the pattern we're in and whether you have the liquidity and quality to not be liquidated.
Take it to the Faro tools
The file teaches you to read the phase. The tools tell you where each name stands today.
This file doesn't promise to guess the next crash. It teaches you to recognize the phase, to reach the fear with cash and quality, and not to be the one who sells at the bottom. That's the whole edge —and it's enough.
Original files
The research folders that underpin this file, in their original form.