INDI — analysis and forecast
🧬 Faro multibagger DNA
Does it look today like the big multibaggers (×10, ×100) did when they started? 7 traits measured with public data.
Strongest: Room to grow and Price vs. growth. Most lacking: Business quality and Cash it generates.
Worth $525 M. To grow ×10 it would have to reach $5.3 B.
Sales +31% last quarter (year over year) and +0% last fiscal year · accelerating.
Gross margin -28%, operating margin -59%, return on equity -44%.
Free cash flow −$38 M a year = -7.2% of its value (burning cash).
Trades at 2.1× sales: 0.14 per point of growth (lower is better).
Net debt equal to 59% of its value.
No recent federal contracts on the radar · inside a Faro megatrend · insiders own 1.5%.
⏱️ Timing (not scored): near its 12-month low · below its 200-day average · trailing the S&P 500 by 55 points over 12 months.
Built on the traits of 365 stocks that went ×100 (Mayer, 1962–2014) and 464 that went ×10 (Yartseva, 2009–2024), plus the Faro thesis. It does not predict the price and is not a recommendation. How it works and the ranking →
🔢 What the numbers say
The last 12 months, in plain words
- Over the last year INDI is down 48.1%. Over about two years: -54.6%.
- Today it sits 59.6% below its 52-week high ($5.34) and +59.0% above the low ($1.36).
- The worst drop from a peak in those 12 months was 74.6%. Anyone who bought at the top had to sit through that.
- It rose on 44% of days. Best day: +33.6%. Worst day: -18.4%.
- Annual volatility around 102%: in a normal year a ±102% move would not be unusual for this stock (the S&P 500 usually runs 15–20%).
🗓️ Forecast by horizon
Directional bias · probability of rising · expected price and likely range (68%)
| Horizon | Bias | Prob. up | Expected price | 68% range |
|---|---|---|---|---|
| 1 day | Neutral | 50% | $2.15 -0.2% | $2.02 – $2.29 |
| 3 days | Neutral | 49% | $2.14 -0.5% | $1.92 – $2.40 |
| 1 week | Neutral | 47% | $2.14 -0.8% | $1.85 – $2.47 |
| 15 days | Neutral | 45% | $2.12 -1.6% | $1.73 – $2.60 |
| 1 month | Neutral | 41% | $2.08 -3.3% | $1.55 – $2.80 |
| 3 months | Bearish | 33% | $1.95 -9.5% | $1.17 – $3.25 |
Recent momentum: +8.0% over 20 days · -46.2% over 60 days. The further out the horizon, the wider and more uncertain the forecast.
📈 Probability cone
📜 Government contracts
We have no notable federal contract on file for INDI. You can look it up yourself at USASpending.gov or in the Government Sources hub.
📚 Go deeper: Faro Library reports
PDF reports built from official filings. Your first one is free, no email; then $1.99 each or all 34 for $25 — included in Navigator and Admiral.
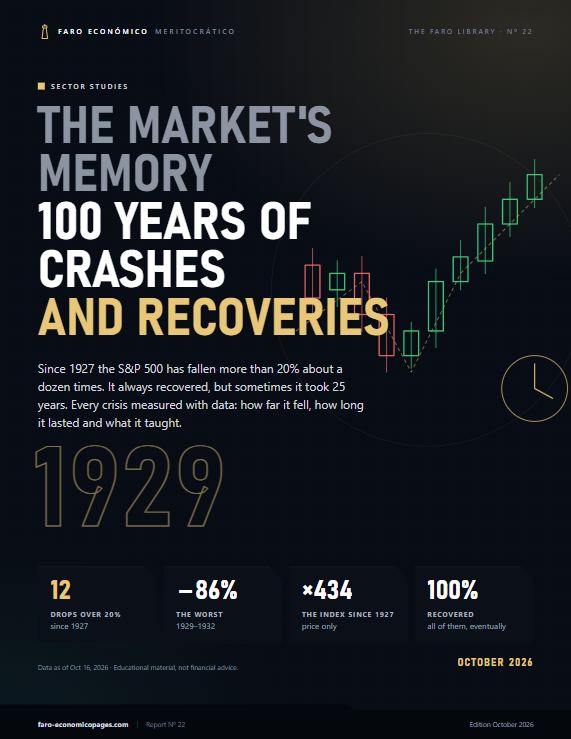 The market's memory: 100 years of crashes and recoveriesSince 1927 the S&P 500 has fallen more than 20% about a dozen times. It always recovered, but sometimes it took 25 y…6 pp. · Free preview →
 Study: What the big winners had in commonMicron 13x, Carpenter 12x, NVIDIA 9x… We analyze the stocks that rose most in five years within the Faro universe: which…6 pp. · Free preview →
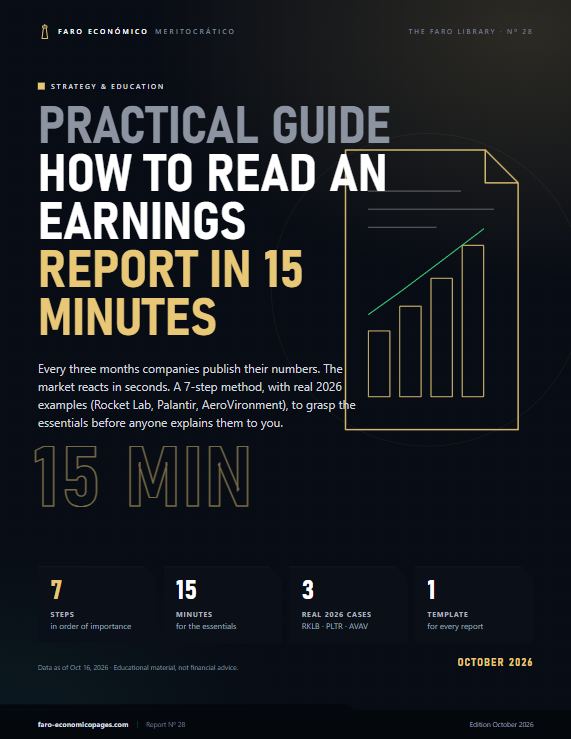 Practical guide: How to read an earnings report in 15 minutesEvery three months companies publish their numbers. The market reacts in seconds. A 7-step method, with real 2026 exampl…6 pp. · Free preview →
❓ Frequently asked questions about INDI
Could INDI be the next NVIDIA?
Its Faro multibagger DNA is 47/100 (mixed): it measures how much it looks today like the big multibaggers did when they started (size, sales growth, quality, cash, price versus growth, balance sheet and public contracts). To grow ×10 it would need to be worth about 10 times today's value. Not a prediction or a recommendation.
How much has INDI fallen in the last year?
indie Semiconductor (INDI) is down 48.1% over the last 12 months and trades at $2.16, 59.6% below its 52-week high ($5.34). 52-week range: $1.36 – $5.34.
How volatile is INDI stock?
Its annualized volatility is around 102% and its worst drop from a peak over the last year was 74.6%. For reference, the S&P 500 usually moves 15–20% a year.
Does INDI have U.S. government contracts?
There is no notable federal contract in Faro's register. You can search USASpending.gov.
Is now a good time to buy INDI?
Nobody can know that for sure and this page is not a buy recommendation. What the data shows today: neutral technical bias, RSI 64, price below its 50-day average and an estimated 41% probability of being higher in 1 month. Use it as a starting point for research, not as a signal.
🧠 How it is calculated
The verdict combines trend (20/50/200 moving averages), momentum (RSI, MACD), mean reversion (Bollinger Bands), conviction (volume) and historical drift, weighted differently for each horizon. Uncertainty is modeled with a lognormal probability cone (geometric Brownian motion). This is statistical analysis, not a crystal ball.
🔦 Keep analyzing
Other stocks Faro watches