IRDM — analysis and forecast
🧬 Faro multibagger DNA
Does it look today like the big multibaggers (×10, ×100) did when they started? 7 traits measured with public data.
Strongest: Business quality and Room to grow. Most lacking: Balance sheet and Sales engine.
Worth $4.9 B. To grow ×10 it would have to reach $49.1 B.
Sales +8% last quarter (year over year) and +5% last fiscal year.
Gross margin 71%, operating margin 19%, return on equity 32%.
Free cash flow $218 M a year = 4.4% of its value.
Trades at 5.4× sales: 0.82 per point of growth (lower is better).
Net debt equal to 42% of its value.
No recent federal contracts on the radar · inside a Faro megatrend · insiders own 11.9%.
⏱️ Timing (not scored): mid-range over 12 months (74%) · above its 200-day average · beating the S&P 500 by 170 points over 12 months.
Built on the traits of 365 stocks that went ×100 (Mayer, 1962–2014) and 464 that went ×10 (Yartseva, 2009–2024), plus the Faro thesis. It does not predict the price and is not a recommendation. How it works and the ranking →
🔢 What the numbers say
The last 12 months, in plain words
- Over the last year IRDM is up 176.7%. Over about two years: +55.5%.
- Today it sits 16.9% below its 52-week high ($55.72) and +192.4% above the low ($15.84).
- The worst drop from a peak in those 12 months was 24.6%. Anyone who bought at the top had to sit through that.
- It rose on 51% of days. Best day: +25.4%. Worst day: -9.1%.
- Annual volatility around 30%: in a normal year a ±30% move would not be unusual for this stock (the S&P 500 usually runs 15–20%).
🗓️ Forecast by horizon
Directional bias · probability of rising · expected price and likely range (68%)
| Horizon | Bias | Prob. up | Expected price | 68% range |
|---|---|---|---|---|
| 1 day | Neutral | 53% | $46.35 +0.1% | $45.50 – $47.22 |
| 3 days | Neutral | 54% | $46.44 +0.3% | $44.96 – $47.95 |
| 1 week | Bullish | 56% | $46.52 +0.4% | $44.62 – $48.49 |
| 15 days | Bullish | 58% | $46.72 +0.9% | $44.06 – $49.55 |
| 1 month | Bullish | 60% | $47.18 +1.9% | $43.33 – $51.37 |
| 3 months | Bullish | 66% | $48.96 +5.7% | $42.24 – $56.74 |
Recent momentum: +2.9% over 20 days · -4.9% over 60 days. The further out the horizon, the wider and more uncertain the forecast.
📈 Probability cone
📜 Government contracts
We have no notable federal contract on file for IRDM. You can look it up yourself at USASpending.gov or in the Government Sources hub.
📚 Go deeper: Faro Library reports
PDF reports built from official filings. Your first one is free, no email; then $1.99 each or all 34 for $25 — included in Navigator and Admiral.
 The space economy the government pays forThe Space Force, SDA and NASA are the anchor customer of the new space race. SpaceX is now public. Who launches, who bui…6 pp. · Free preview →
 Golden Dome: The shield and who builds it$185 billion per the Pentagon, $1.2 trillion per Congress's budget office. The most ambitious missile-defense program si…6 pp. · Free preview →
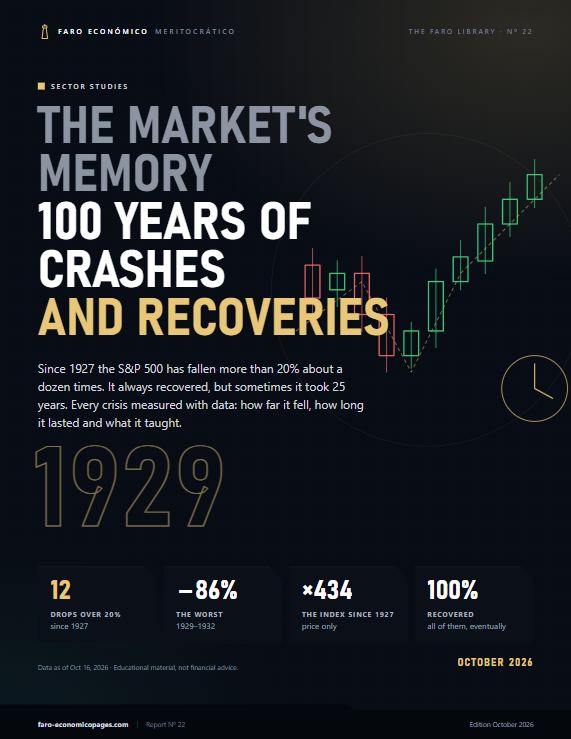 The market's memory: 100 years of crashes and recoveriesSince 1927 the S&P 500 has fallen more than 20% about a dozen times. It always recovered, but sometimes it took 25 y…6 pp. · Free preview →
❓ Frequently asked questions about IRDM
Could IRDM be the next NVIDIA?
Its Faro multibagger DNA is 59/100 (mixed): it measures how much it looks today like the big multibaggers did when they started (size, sales growth, quality, cash, price versus growth, balance sheet and public contracts). To grow ×10 it would need to be worth about 10 times today's value. Not a prediction or a recommendation.
How much has IRDM gone up in the last year?
Iridium Communications (IRDM) is up 176.7% over the last 12 months and trades at $46.31, 16.9% below its 52-week high ($55.72). 52-week range: $15.84 – $55.72.
How volatile is IRDM stock?
Its annualized volatility is around 30% and its worst drop from a peak over the last year was 24.6%. For reference, the S&P 500 usually moves 15–20% a year.
Does IRDM have U.S. government contracts?
There is no notable federal contract in Faro's register. You can search USASpending.gov.
Is now a good time to buy IRDM?
Nobody can know that for sure and this page is not a buy recommendation. What the data shows today: bullish technical bias, RSI 58, price below its 50-day average and an estimated 60% probability of being higher in 1 month. Use it as a starting point for research, not as a signal.
🧠 How it is calculated
The verdict combines trend (20/50/200 moving averages), momentum (RSI, MACD), mean reversion (Bollinger Bands), conviction (volume) and historical drift, weighted differently for each horizon. Uncertainty is modeled with a lognormal probability cone (geometric Brownian motion). This is statistical analysis, not a crystal ball.
🔦 Keep analyzing
Other stocks Faro watches